What is a dump point, and why it drives your haul cycle numbers
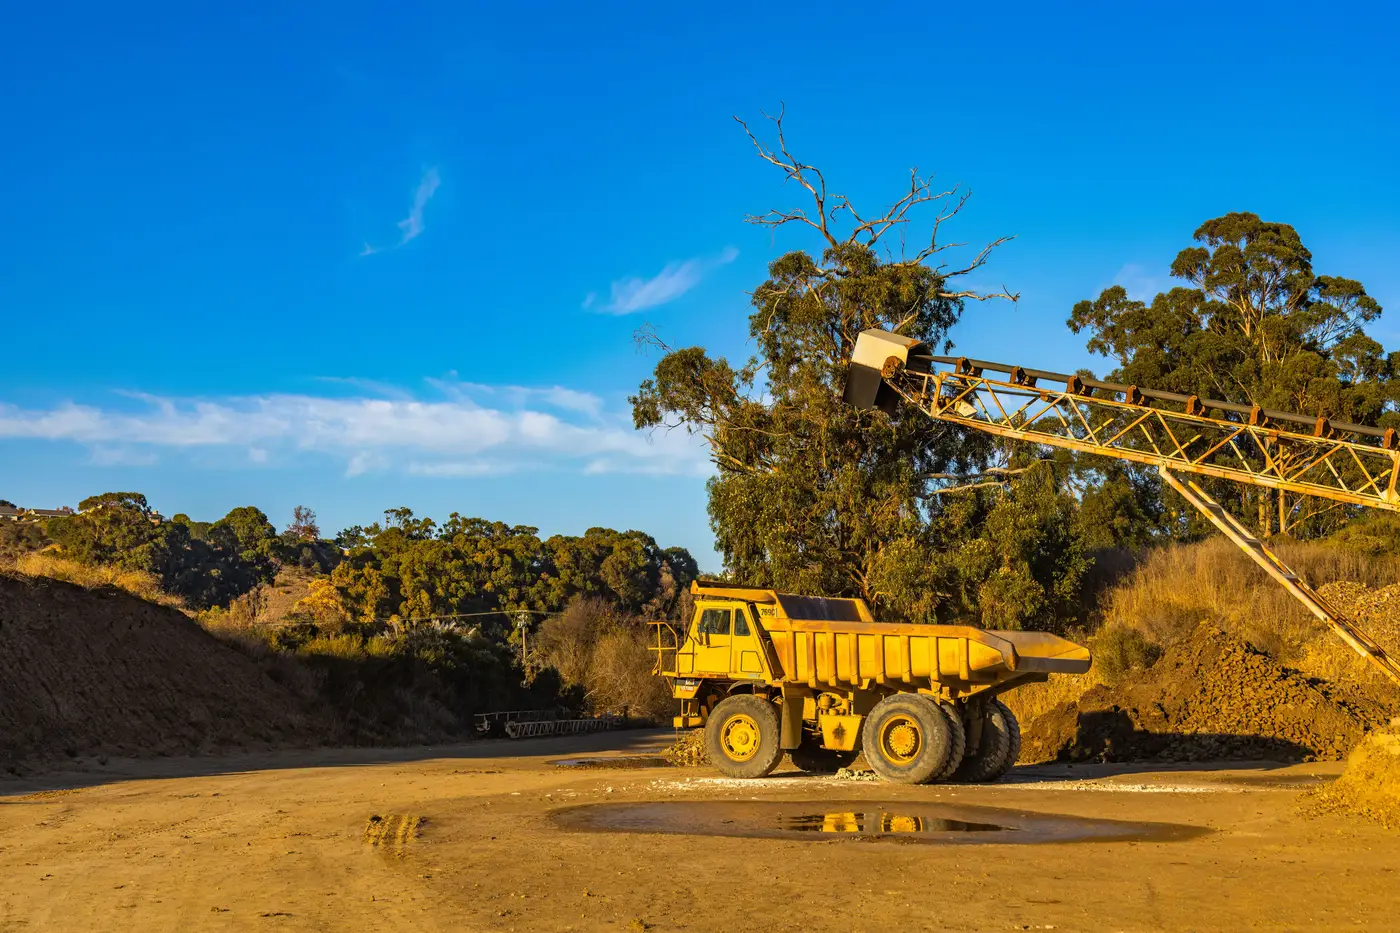
A dump point is wherever a haul truck empties its load. That's the definition, and it's about as far as the term goes on its own. What matters for cycle-time work is which kind of dump point you're looking at, because the two main types behave nothing alike.
Crusher tip vs waste dump point
A crusher tip (or ROM pad, or primary crusher feed, depending on your operation's vocabulary) is a fixed, constrained destination. There's usually one approach, a single tip point or a small number of bays, and a queue that forms whenever truck arrivals outpace the crusher's feed rate. Spotting time at a crusher tip tends to be short once a truck gets its turn, but the wait to get that turn is where the variability lives. If you've ever watched a crusher tip at shift change, you've seen four trucks stacked up doing nothing but idling.
A waste dump (or waste dump point, overburden dump, whatever the pit calls it) is the opposite kind of problem. It moves. Tip heads advance as the pile grows, which means haul distance to this kind of destination creeps up week over week even when nothing else about the operation has changed. Spotting here also runs longer than at a crusher tip, since trucks are backing to an edge rather than pulling into a fixed bay, and a dozer or grader working the face can hold trucks up entirely for a few minutes at a time.
Confusing the two in a cycle-time model gives you the wrong fix. Waste dump spotting time that creeps up over a few weeks usually means the tip head moved further from the ramp, and the fix is dump planning: shorten the haul distance or open a second tip head. A crusher queuing trucks calls for a different fix, a better feed rate or tighter dispatch sequencing. A single "dump point delay" number that blends both tells you delay went up without telling you which lever to pull.
Why dump point activity matters for haul cycle analysis
Cycle time breaks into legs: load, haul loaded, spot and dump, haul empty, and queue at both ends. The destination touches three of those legs directly, since spotting, dumping, and any wait ahead of the tip all happen there. For most pits running a crusher paired with a waste dump, the back half of the cycle carries more swing than the haul road itself. A haul road holds its travel time fairly steady day to day. A truck's wait and spot time at the destination can double on a bad shift, and nobody upstream necessarily knows why.
This is also where a visit from outside the fence, or a competitor read from imagery, tends to go wrong if the analyst treats every empty-truck destination as interchangeable. A truck idling at a crusher tip and a truck backed up waiting its turn at a waste dump look similar from above. Counting them the same way, without separating dump type, flattens two very different signals into one.
If you're trying to benchmark fleet activity without telematics access, the dump point is one of the few places where truck behavior on the ground shows up clearly from imagery. A string of trucks queued at a fixed point reads as a crusher-side bottleneck. Trucks spread along an advancing edge with gaps between them reads as waste dump movement. Counting trucks at each kind of dump point, on a regular cadence, gives you a read on which end of the cycle is under pressure, without needing a site visit or access to the haul truck fleet management system.
For an operator watching your own site, or an analyst sizing up someone else's, that dump point count on a given day beats a static map of pit layout by a wide margin. A daily truck count across the haul network, paired with a road condition read, is what turns "there seem to be more trucks at the dump" into something you can put a number on. If dump point behavior is the thing you're trying to track, start there.