Spotting haul road rutting and washouts in satellite imagery
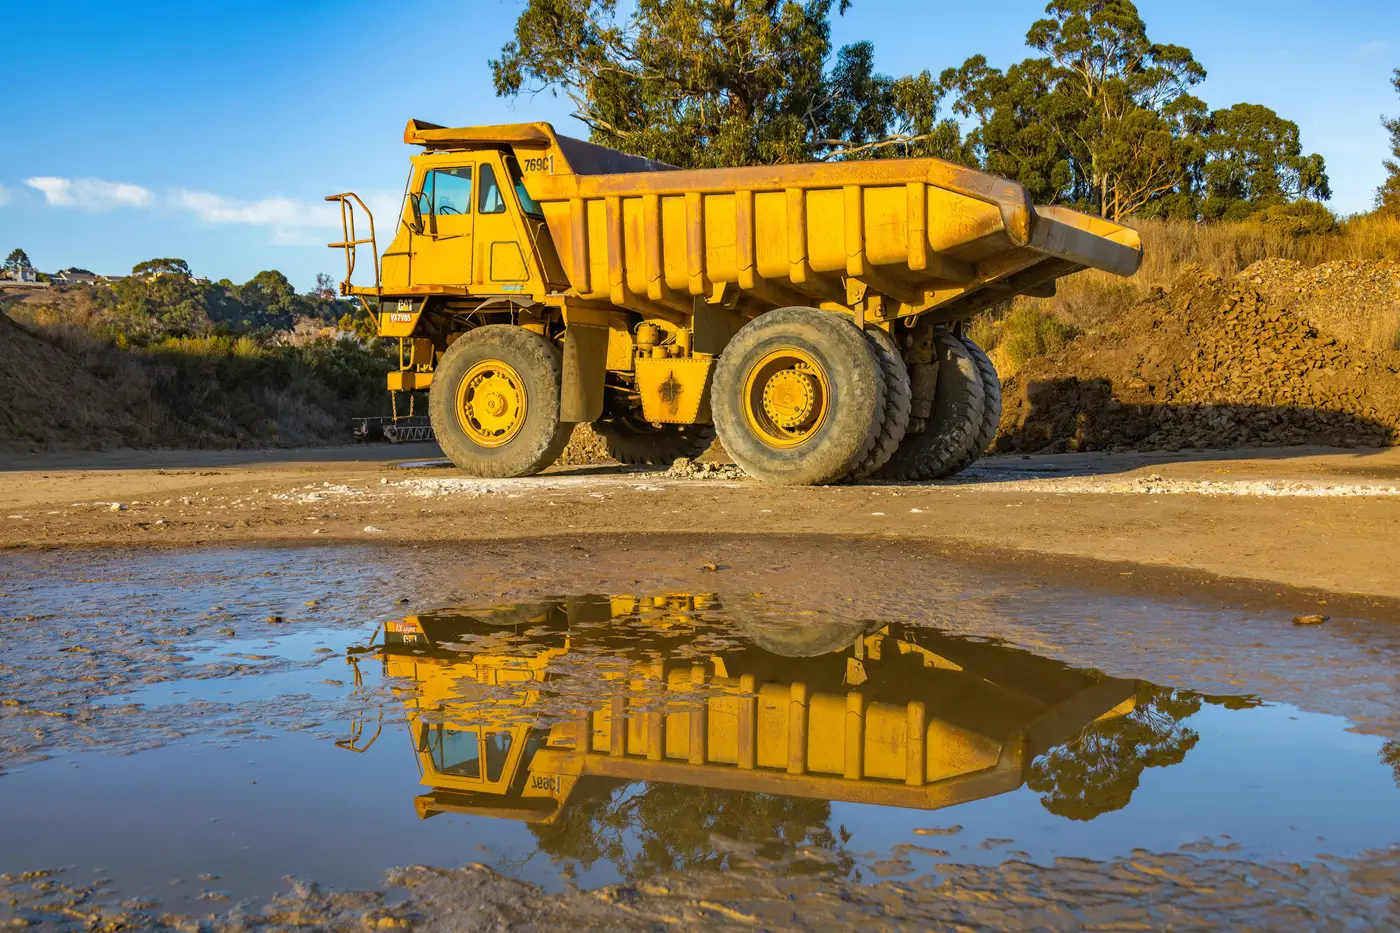
A haul road doesn't fail all at once. It degrades in stages, and most of those stages show up in overhead imagery well before a grader crew gets flagged or a truck gets bogged. If you're trying to read surface condition from outside the fence, whether for a benchmarking study or a competitor watch, the signals are there. You just have to know what you're looking at.
What rutting looks like from above
At sub-0.5 m resolution, rutting shows up as parallel tonal banding running in the direction of travel, usually two to four tracks wide depending on whether it's a single-lane ramp or a dual-lane haul segment. Fresh ruts read darker than the surrounding running surface because they're holding shadow and often a thin film of moisture even in dry weather. Older, compacted ruts flatten out tonally and get harder to pick up, which is itself useful: a road that shows sharp banding today and smoother banding in last month's pass has probably had grader attention in between.
Washouts are easier to call with confidence. Look for a break in the road's linear continuity, a notch or scallop cut into one edge, sediment fanned out downslope from the break, and standing water pooled at the low point if the event is recent. On a ramp with cross-fall toward a ditch, the tell is often not the road itself but the ditch line: a drainage channel that's silted in or blown out along a 20-30 m stretch usually means the road above it has been shedding water badly for a while, not just after one storm.
Berm condition is worth checking at the same time. A continuous, even shadow line along the road edge means the berm is intact. Gaps, slumping, or a berm that's been pushed inward by equipment all change that shadow pattern, and a missing berm next to a washout scallop is a stronger signal together than either one alone.
Wet-season degradation signals
Wet season changes what you're looking for more than it changes the method. Ponding on the running surface is the clearest early signal: standing water sits as a flat, uniform dark patch, distinct from the linear shadow of a rut, and it tends to collect at the same low points pass after pass if drainage hasn't been fixed. If you're pulling daily imagery across a wet-season stretch, a pond that persists for three or four consecutive clear-sky days at the same chainage is telling you something about that section's crown or cross-fall, not just that it rained.
Track width is another one. On a road that's wet and soft, trucks tend to spread out laterally to avoid the worst ruts, so the travelled surface visibly widens compared to its dry-season footprint. That widening, plus a drop in tonal uniformity across the road width, is a reasonable proxy for surface softening even without a single rut you can point to.
Timing matters here more than usual. Shadow length and sun angle shift through the day and through the season, and a feature that reads as a clear rut at low sun angle can wash out almost entirely near midday. If you're comparing condition across weeks, it helps to keep the comparison anchored to similar capture times, or at least be aware that a road that "looks fine" at noon may not have improved at all.
Reading condition alongside activity
Surface condition on its own tells you something about maintenance and weather exposure. Paired with how many trucks are actually running that segment each day, it starts telling you something about cycle time and utilisation, which is the harder number to get from imagery alone without a site visit or telematics feed. Mine Fleet Activity runs a daily truck count on a defined haul network alongside a road condition read pulled from the same VHR passes, so the two signals sit next to each other instead of living in separate reports.
If you're trying to put a wet-season slowdown or a persistent bottleneck segment into numbers rather than anecdotes, that's worth a look.