Field notes: the month we counted trucks on a haul road we'd never driven
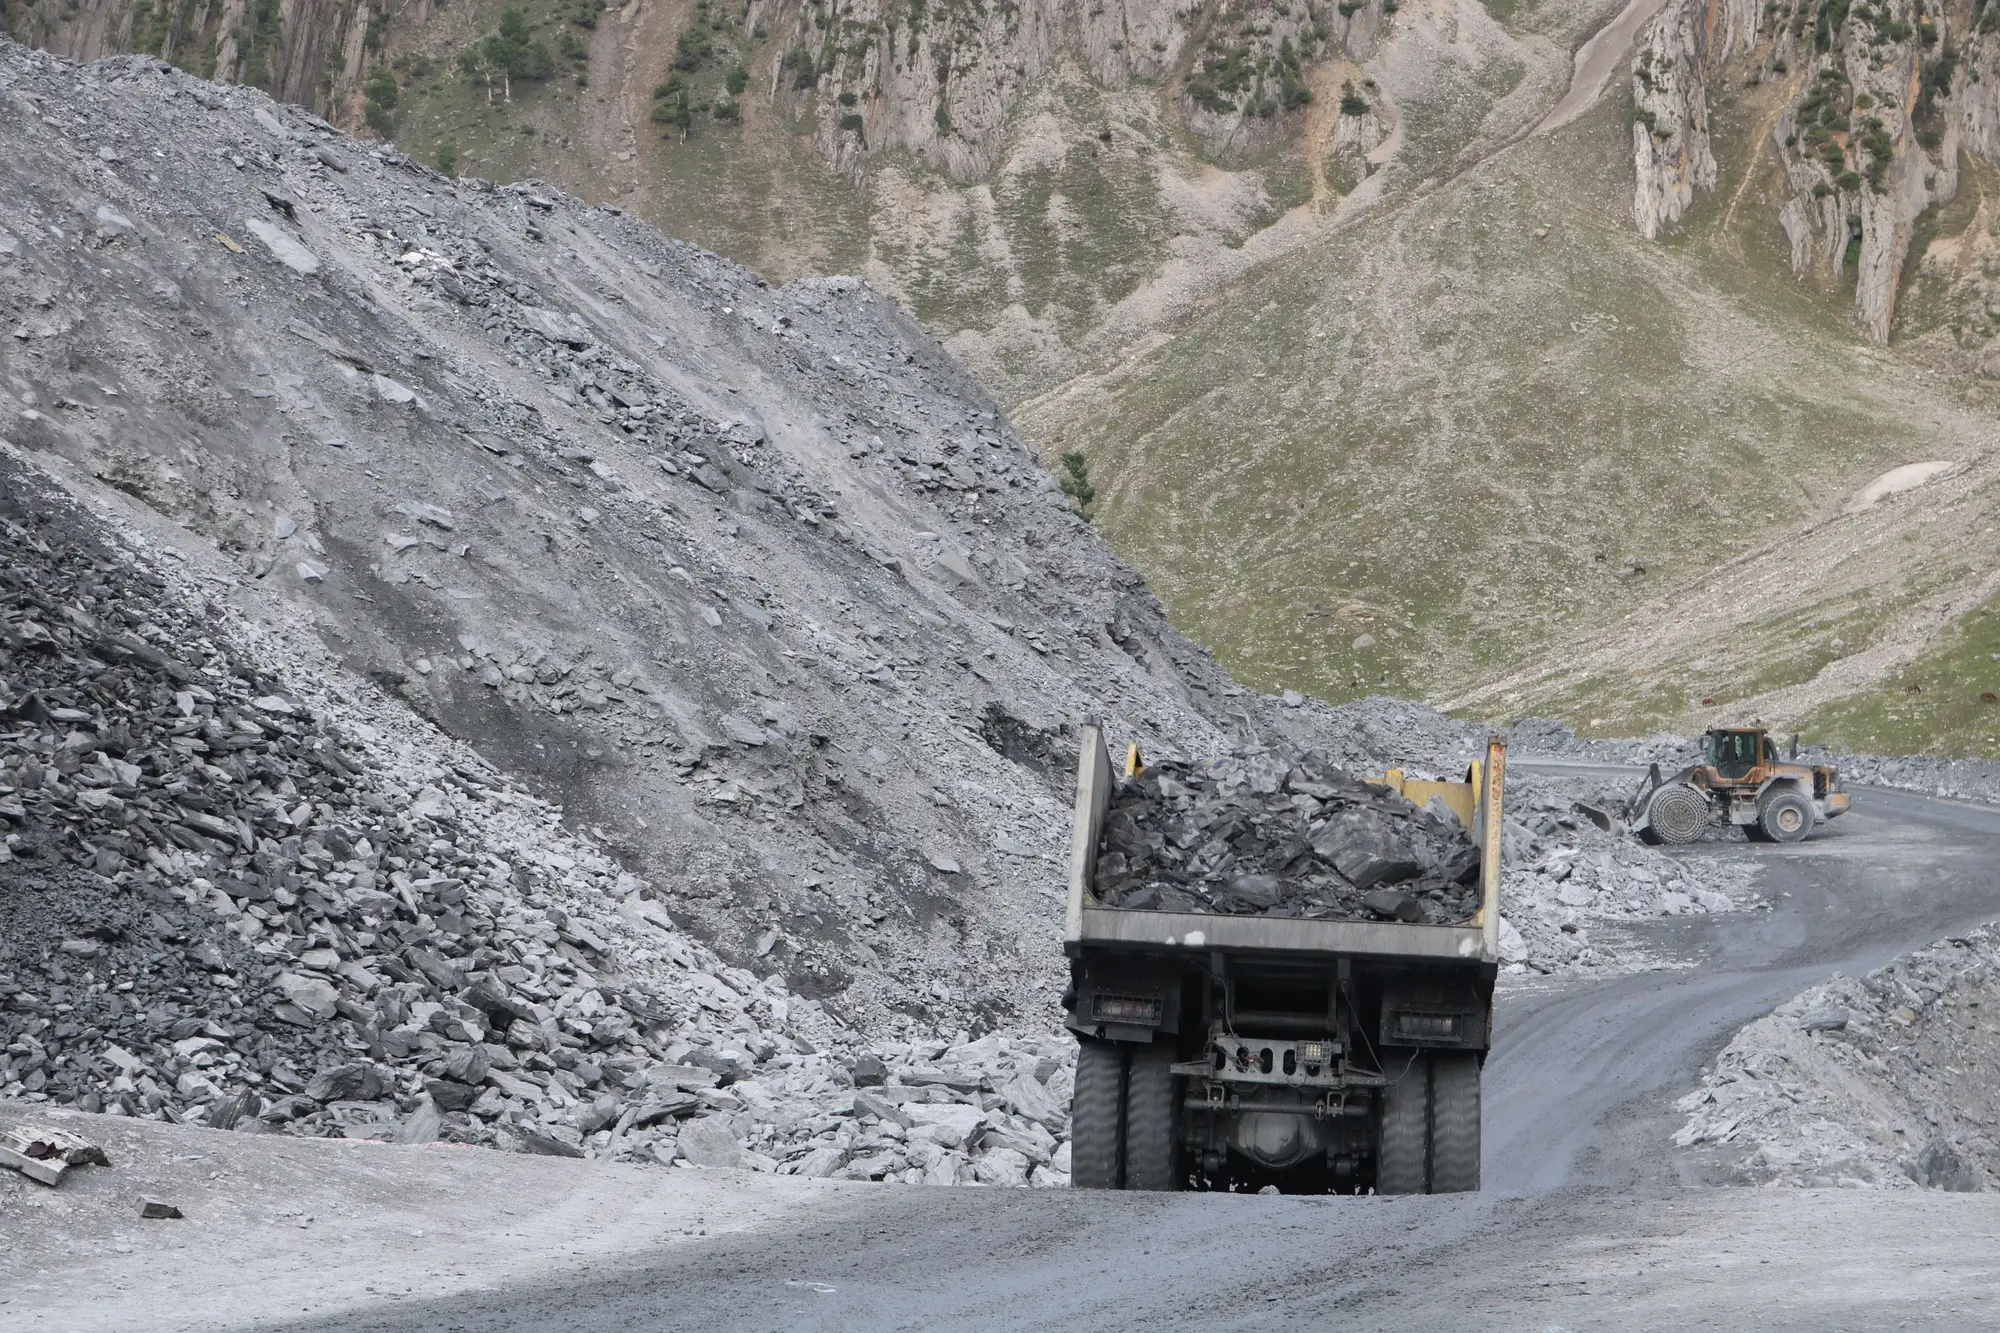
We never set foot on this mine. Didn't need to. A client wanted to know how a nearby competitor's haul fleet was running through a permit dispute, and the only honest way to answer that from outside the fence was to watch the road.
So for a month we watched one haul road. Not the pit, not the crusher, just the stretch between the east pushback and the ROM pad, maybe two kilometers of switchback with a single blind corner where the grade kicks up. Every day, same pass, same light conditions as close as we could get them. Count the trucks sitting on the road or queued at the dump point, note where the shadows fall, log it, move on.
The first week was boring in the way good data collection is supposed to be boring. Somewhere between fourteen and eighteen trucks visible on the network at any given daytime pass, which lines up with what you'd expect from a mid-size fleet running two shovels on that side of the pit. Nothing surprising. We were mostly checking that our counting held up against obvious things, like shift change gaps, before we trusted it on anything subtler.
Then it rained for four days straight, and the road told us more than the truck count did.
By day three of the wet spell the switchback had gone soft at the outside edge. You could see the rutting start to shadow differently in the imagery, a texture change where the running surface used to be flat and reflective and was now chewed up and dark. Truck numbers on that section dropped by roughly a third over the same window, and the fleet hadn't shrunk at all. Every loaded truck coming down that grade was slowing to a crawl through the bad patch, and the queue backed up at the dump point instead of spreading out along the road the way it does on a dry day. Cycle time went up without a single truck leaving service.
You'd never catch that from a monthly production report, and you'd barely catch it from inside the fence unless you happened to be standing at that corner.
What struck us more than the rain, honestly, was the night-shift pattern once things dried out. We'd assumed night counts would just be a scaled-down version of day counts, fewer trucks, same shape. Instead the night network ran leaner but steadier, less bunching at the dump point, which told us more about how they were sequencing loads after dark than any public document was going to. We weren't trying to reverse-engineer their dispatch logic. But count the same road every day for a month and the rhythm of a fleet starts to show itself, wanted or not.
By week four the road had been bladed and the counts climbed back to something close to the early baseline, maybe a notch higher, which could mean a third shovel came on or could mean they were clearing a backlog from the wet week. We flagged it as the latter and moved on. That's the honest limit of this kind of work. A truck count and a road-condition read tell you what moved and roughly how freely it moved. They don't tell you why a shovel got added or pulled, and anyone who claims otherwise from satellite imagery alone is selling something.
What they do tell you is whether a competitor's haul network is actually busier than their press releases suggest, or quieter, and whether the road itself is helping or hurting them. That daily count and condition read is more or less the whole premise behind Mine Fleet Activity, built for exactly this kind of question, where you need an activity benchmark and nobody's handing you telematics.
If you've got a haul road you need eyes on from outside the fence, that's the kind of daily read Mine Fleet Activity is built to give you.